Kinsta Hosting Performance: Independent Research on NapLab.com & WordLift.io
Inside Two Kinsta-Associated Websites
Independent PageSpeed and WebPageTest observations of NapLab and WordLift.
October 28, 2026 · 2 sites · 4 PageSpeed reports · 4 WebPageTest observations
Two different websites, two different workloads


Performance at a glance
Two websites. Two device experiences. One consistent measurement framework.
The fast first-byte readings (78–100ms in desktop WebPageTest runs) are consistent with responsive delivery at the CDN edge, but do not isolate Kinsta’s origin server. The biggest differences appear later: WordLift transfers substantially more data and runs more page scripts, which affects loading after the initial response. Those are site-level factors, not evidence that Kinsta hosting is slower. Coming next: additional matched tests and origin-attribution checks will help us distinguish hosting delivery from page-level effects.
PageSpeed Insights: where the differences appear
What These Results Tell Us PageSpeed measures the finished page, not just the server. NapLab.com’s stronger lab results and WordLift.io’s heavier rendering illustrate how images, scripts and layout can affect speed beyond Kinsta’s origin and CDN. These scores alone cannot establish which hosting setup performs better.
Visual comparison of Lighthouse laboratory measurements. For these loading-time and blocking-time measures, shorter bars are better; a longer bar means more time elapsed. Pink identifies NapLab.com and blue identifies WordLift.io. Status colors are independent of website identity.
Mobile loading metrics
3.6 s
6.8 s
1.9 s
6.2 s
120 ms
200 ms
Desktop loading metrics
0.7 s
1.2 s
0.5 s
0.9 s
0 ms
340 ms
Exact PageSpeed measurements
PageSpeed Insights laboratory results. Scores describe these page runs, not HRL hosting ratings.
Original reports: NapLab mobile · NapLab desktop · WordLift mobile · WordLift desktop. Field Core Web Vitals are separate rolling real-user aggregates.
WebPageTest: Looking behind the scores
What These Results Tell Us Both desktop tests returned an initial response quickly (NapLab.com 100ms; WordLift.io 78ms), but that response may come from Cloudflare’s edge rather than Kinsta’s origin. WordLift.io transferred about 4.96MB over 107 requests versus NapLab.com’s 336KB over 34 requests. The longer load therefore highlights a heavier website workload, not proven weaker Kinsta hosting.
One first-view run per site and viewport. WordLift transferred roughly 15 times as much data as NapLab in the desktop observation.
One first-view observation per site and viewport. Measurements include CDN and site-level components, not isolated Kinsta origin performance.
PageSpeed evidence: Original screenshots
Hosting takeaway: Real-user Core Web Vitals show what visitors experience across the full delivery stack, including CDN, website design, and third-party code—not the hosting server in isolation.
Full-size screenshots grouped by website and device, showing Google’s 28-day real-user Core Web Vitals panels. Lighthouse lab scores are presented separately in the comparison section above.
NapLab.com · PageSpeed evidence
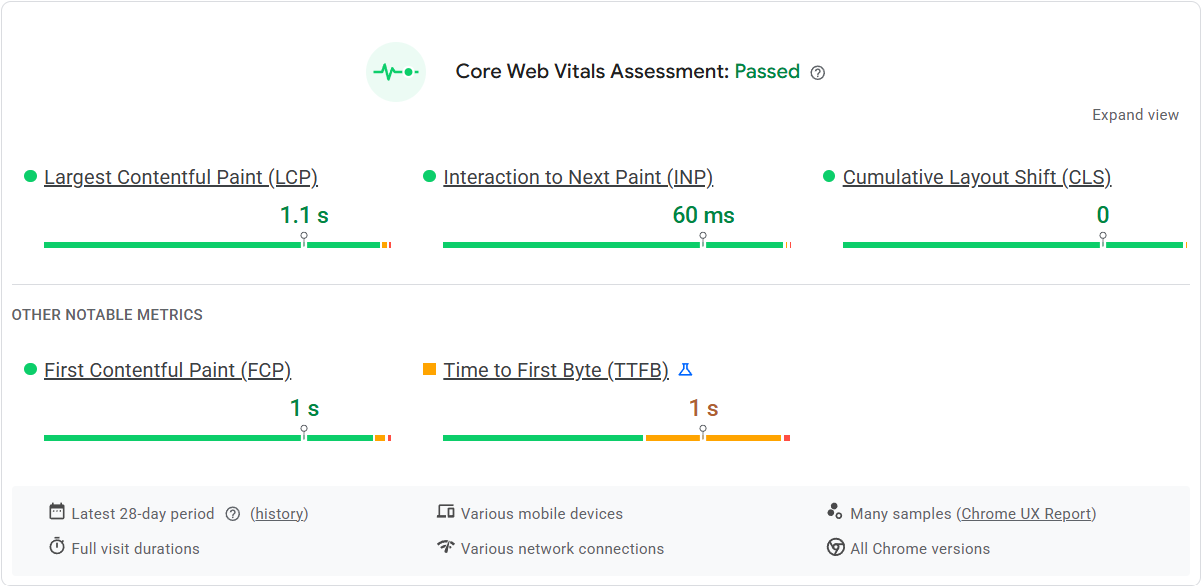
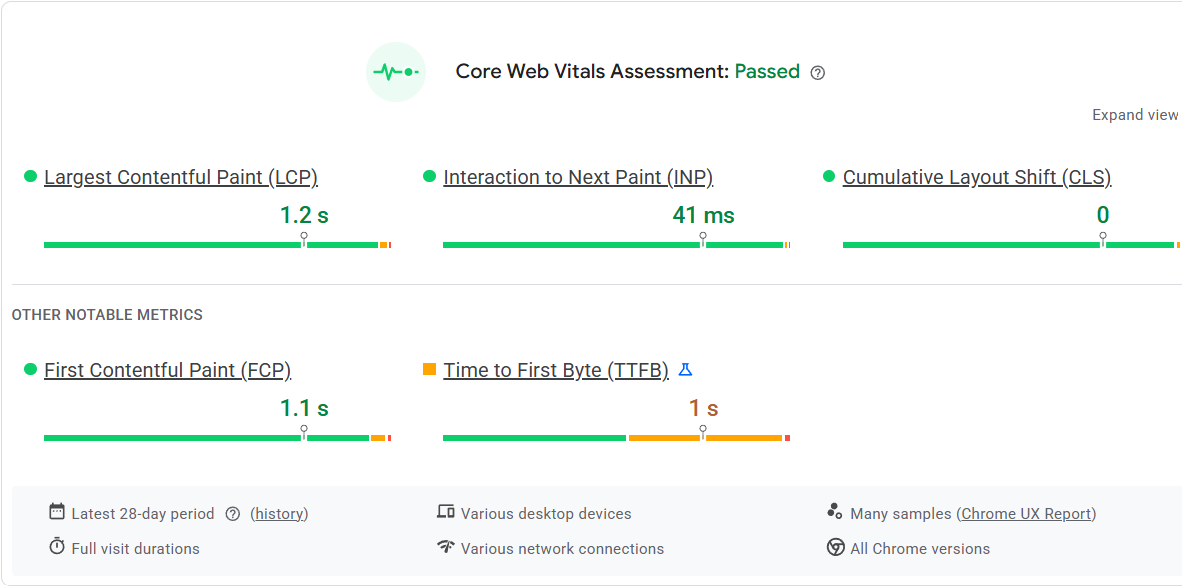
Explore plans and features; public customer-page results aren’t isolated hosting benchmarks.
WordLift.io · PageSpeed evidence
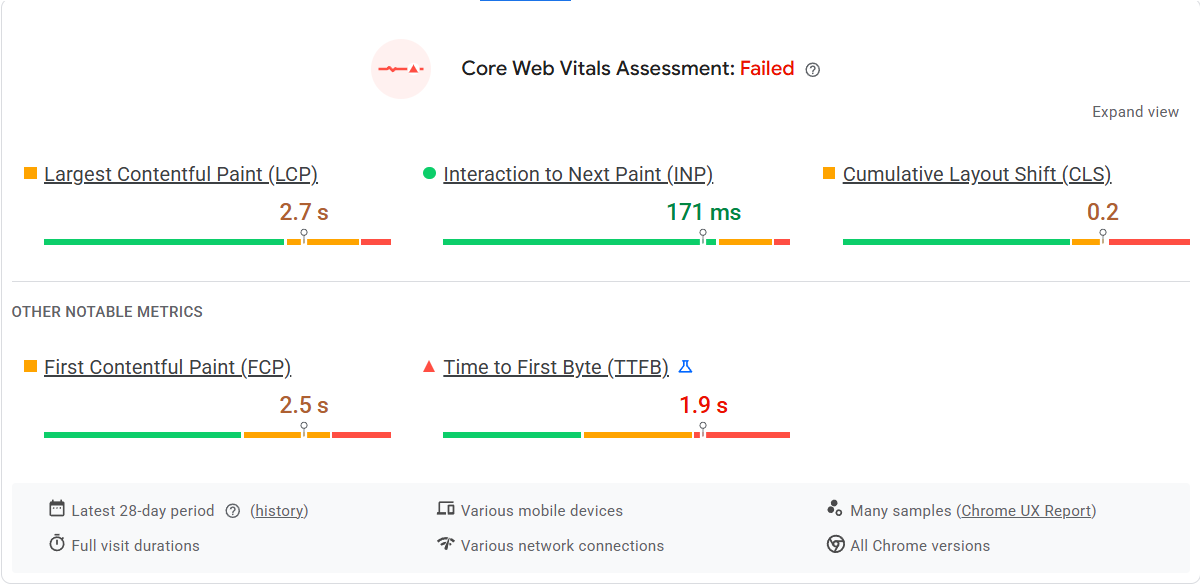
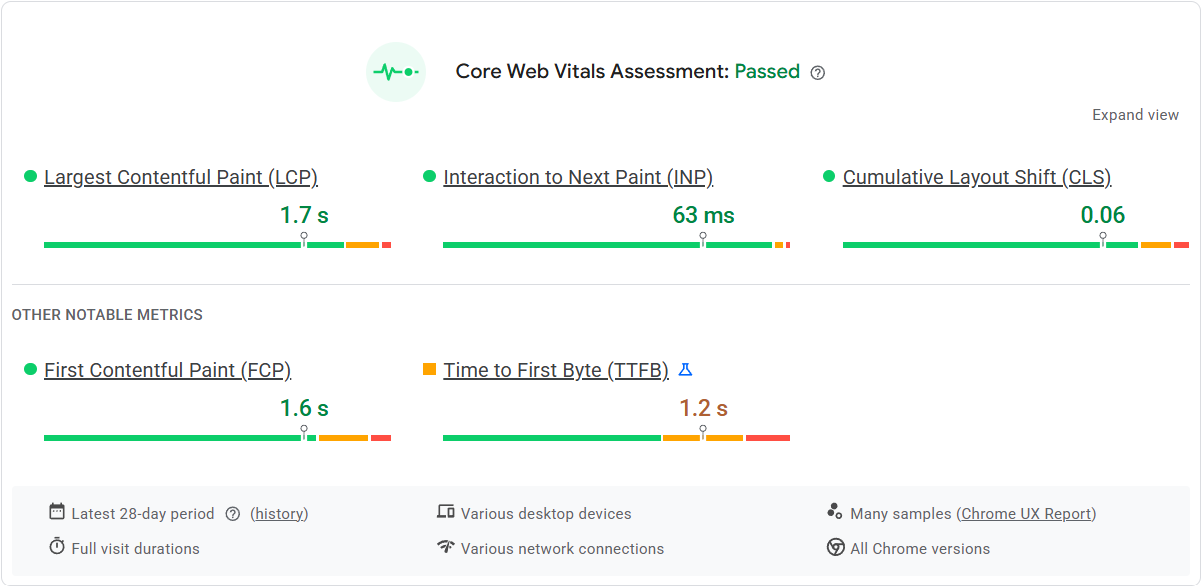
Additional WebPageTest waterfalls and repeat-run evidence remain outside the scope of these screenshots.
Interpretation and methodology
These public-page observations measure complete website delivery stacks, not Kinsta origin-server performance. Kinsta case studies and BuiltWith reports corroborate association, without proving current origin configuration. Both sites use Cloudflare signals; NapLab also uses BunnyCDN for images. Repeatability, precise matching of network/location profiles, and verified current hosting remain research limitations.
NapLab case study · WordLift case study · HRL Kinsta provider review
Interested in hosting your own WordPress site with Kinsta?
NapLab.com and WordLift.io are featured in Kinsta’s customer stories. Our independent page tests reflect each site’s full delivery stack, so results should not be treated as direct measures of Kinsta’s server performance.
Hosting Review Lab may earn a commission from qualifying referrals. Check Kinsta’s current plans and terms before purchasing.
The research conclusion
Fast first-byte delivery is not synonymous with fast, stable rendering. Page composition, imagery, JavaScript, third-party services, and CDN behavior matter. This is the first installment of our ongoing Kinsta-associated customer-site research. Check back for additional matched runs, updated observations, and a clearer picture of what can be attributed to the hosting environment.